RESOURCES
Surveys
We offer surveys that have been cultivated over decades of working with companies trying to build value and improve their business. By taking advantage of the surveys and completing them you will be provided with immediate feedback on a measure of your business, as well as how you rank against the other businesses that have completed the survey.
profitable roadmap assessment
So many businesses are highly focused on growth, which is understandable. However revenue growth without just as much focus on profit levels and all you’ve created is a really hard job. The key is developing a focused strategy on growing profits. Every business intends to make a profit, but few make it the driving measure of success that it needs to be to truly act as the internal combustion engine for the company’s growth.
TAKE OUR ASSESSMENTorganizational effectiveness assessment
Assessing and learning about your organizational effectiveness on a broad holistic, total organization perspective provides senior business leaders what organizations need to do to achieve optimal short and long-term performance. This is a comprehensive assessment that looks at an organization from a cross-functional view.
TAKE OUR ASSESSMENTEnterprise Value Map
The philosophy of managing for shareholder value is also knows as value-based management (VBM), which is defined as a system to measure for Shareholder Value from an investor’s perspective is the Total Shareholder Return (TSR).
TSR can be calculated as followed:
TSR =
- ((Share Price End of Period - Share Price Begin Of Period) + Dividends)
- Share Price Begin Of Period
Creating shareholder value is not about applying a set of tools or processes but about creating competitive advantage as part of an organization’s strategy by understanding value drivers and their interactions, which is one of the difficulties of developing strategy.
To optimize shareholder value organizations can apply performance measures to assess the business performance. The first performance measures focused on cost efficiency and effectiveness. The next generations of new performance measures also measure both tangible and intangible value. The balanced score card does not only balance financial and non-financial measures but also links performance to organization goals.
Traditional performance measures focus entirely on cost efficiency and effectiveness. Examples of such measures are the Earning per Share (EPS), Return on Capital employed (ROCE), return on net worth, net profit margin etc. The concept of Shareholder Value has changed the performance appraisal criteria of organizations from cost efficiency and effectiveness to new value based performance measures. These new performance measures measure both tangible and intangible value. Examples of new performance measures are Market value Added, Economic Value Added, Cash Value Added, Total Quality management and the Balanced Score Card (BSC). The main difference between traditional performance measures and value-based performance measures is that traditional performance measures focus on short-term performance whereas value based performance also take long-term performance into account.
The Enterprise Value Map (EVM) not only balances financial and non-financial measures but also links performance to rewards and gives recognition to the diversity of organizational goals, it also links performance to the organization’s strategy.
Shareholder Value
Shareholder value is the top of the EVM and refers to the ultimate goal of organizations to optimize shareholder value. Shareholder value is driven by the lower-level value drivers. The EVM is a tool developed to help facilitate year over year strategy plans, based on the strategy map, which enables organizations to relate shareholder value and the steps companies can take to improve their operations
The structure of the EVM is shown in below and contains the following three levels:
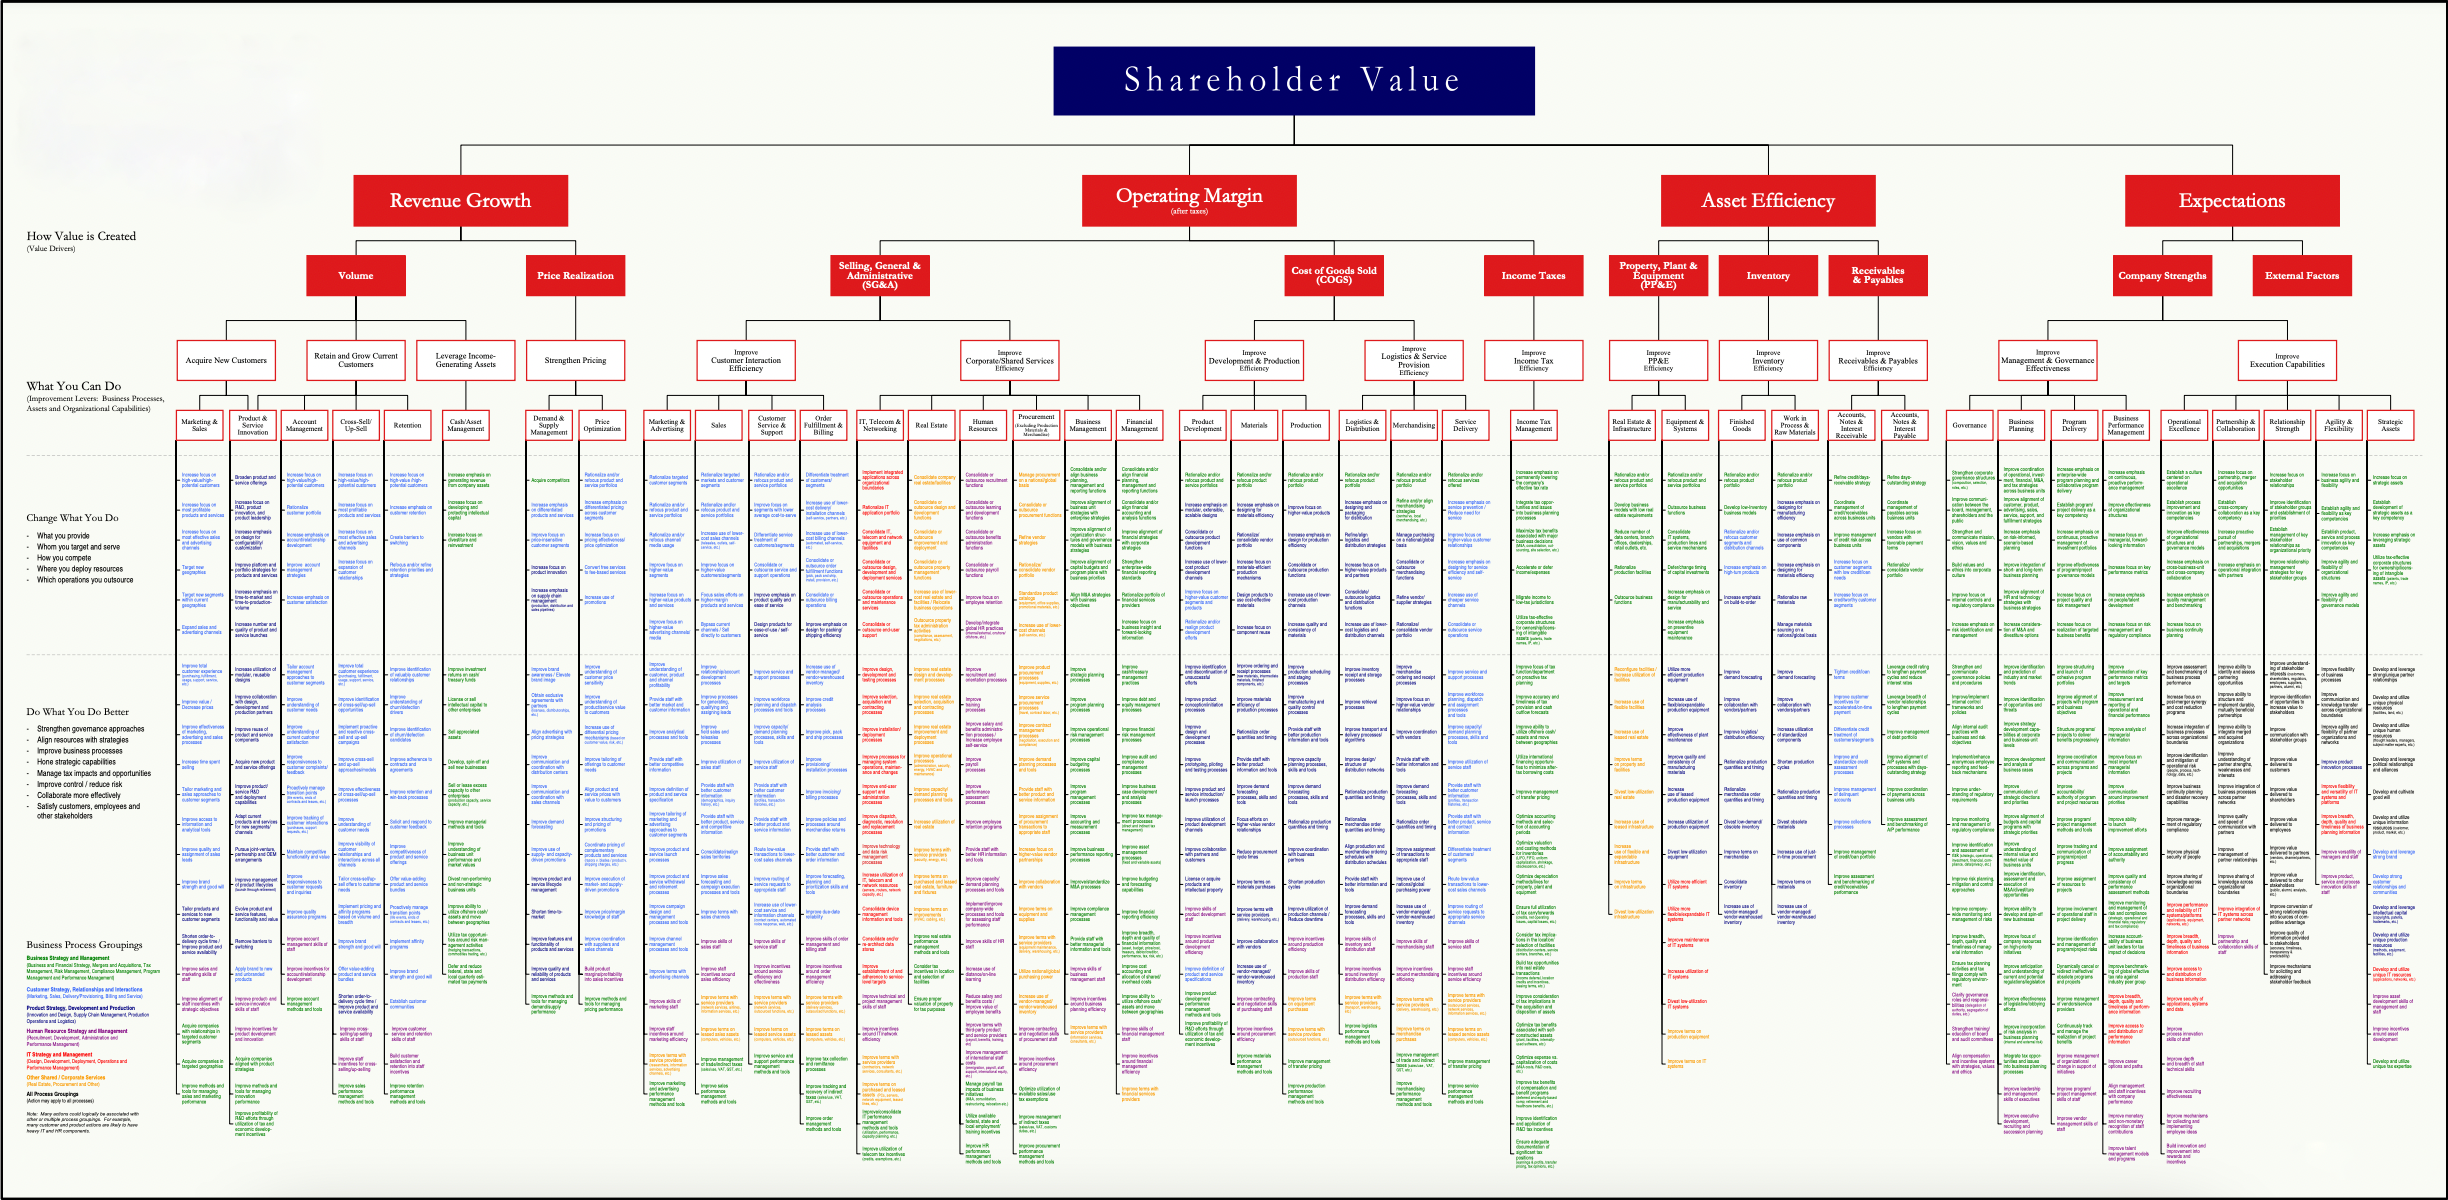
Value Drivers
The EVM distinguishes four main value drivers that drive Shareholder value. These value drivers are revenue growth, operating margin, asset efficiency and expectations as shown in Appendix A. Typically this means that if three value drivers are held constant and one driver improves this will result in increased shareholder value. However according to the first principle of strategy maps these drivers will have a substantial influence on each other and a balance should be found.
Three of the value drivers are related to the four financial perspectives of the BSC strategy map.
- Revenue growth is derived from the expand revenue opportunities perspective and enhance customer value perspective
- Operating margin is derived from the improve cost structure perspective
- Asset efficiency is derived from the improve asset utilization perspective
These three value drivers relate to the dividend part of the definition of shareholder value. However, shareholder value is also based on the share price, which results in a fourth value driver “expectations”. According to the EVM expectations, which is the confidence of shareholders and analysis in the organization’s ability to perform well in the future, is the key driver for share price. To relate the value drivers to level-lever improvement levers the value drivers are broken down into sub-value drivers.
Improvement Levers
Improvement levers are high level steps an organization can take to improve value driver performance. These improvement levers are based on the customer perspective; internal process perspective and learning and growth perspective form the strategy map.
The EVM enables organizations to relate shareholder value and the steps companies can take to improve their operations. These steps are referred to as improvement actions, which are related to the different improvement levers.